Oscilloscope give automotive maintenance engineers a direct way to observe the electrical signals produced by electronic sensors. For a Hall camshaft position sensor, waveform frequency and timing can provide useful information that is not available from a simple static reading. The Owon VDS2064 oscilloscope can be connected to the sensor so its signal can be viewed on a PC.
Why Test a Hall Camshaft Position Sensor ?
The camshaft position sensor produces a signal associated with camshaft movement. When examining a Hall sensor with a digital oscilloscope, frequency is one of the primary waveform characteristics to check. Capturing the signal at different engine speeds allows the technician to see how the frequency changes while also examining the overall waveform pattern.
Camshaft and crankshaft sensors also have a defined phase relationship. Their waveforms contain reference features described as marking teeth. The difference in the number of teeth between these reference points is expected to remain fixed. A difference of one tooth more or less can affect engine operation and may result in a no-start condition. Viewing both timing-related patterns therefore helps the technician assess more than the presence of an electrical signal alone.
Connecting the OWON VDS2064
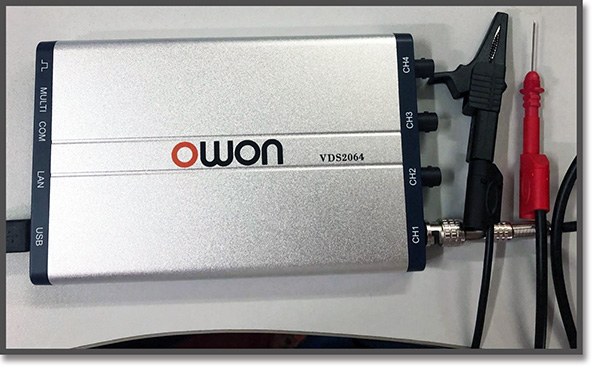
The measurement setup uses the BNC interface of the OWON VDS2064 and a suitable tip probe at the test end. The red probe connection is inserted at the Hall camshaft sensor signal point.
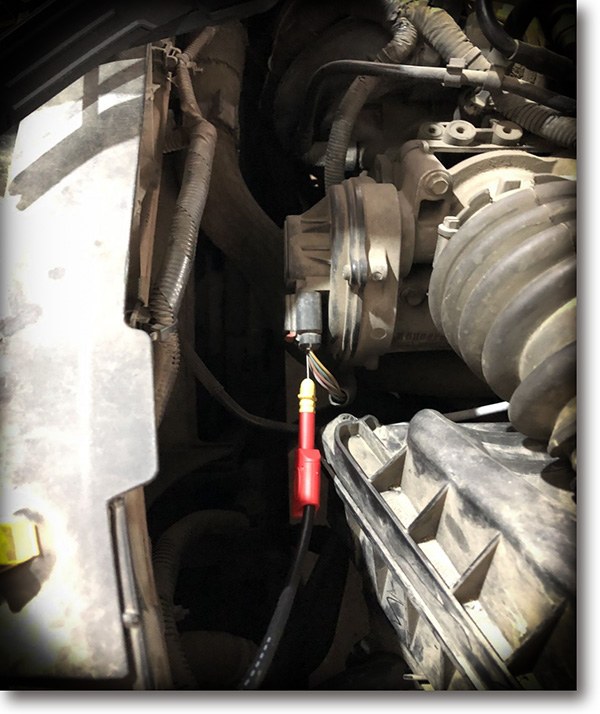
The black clip provides the ground connection and is attached to a metal part of the vehicle. With the signal and ground connections in place, the oscilloscope can capture the sensor waveform for examination on the connected computer.
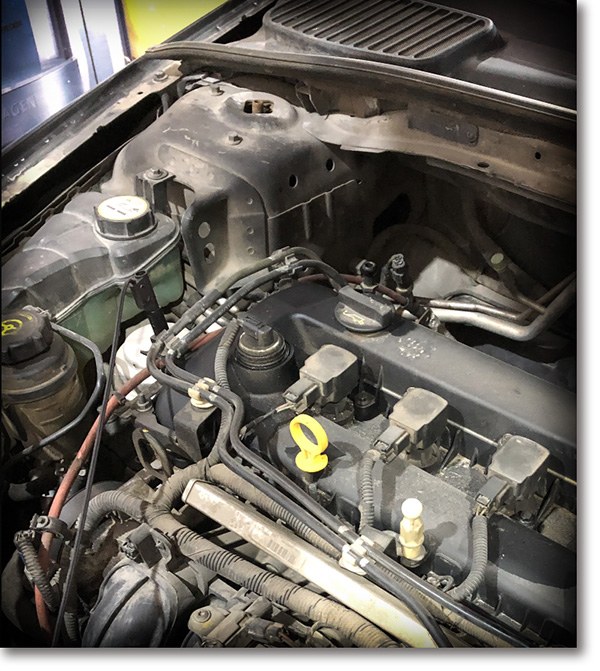
Observing Frequency at Different Engine Speeds
Testing at different engine speeds makes it possible to compare the frequency of the Hall camshaft sensor output under changing operating conditions. The source examples use two horizontal time-base settings while retaining the same vertical scale.
Waveform at 25 ms/div and 1 V/div
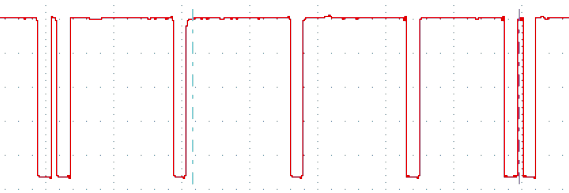
At 25 ms/div, a broader time window is visible across the display. This view can help show the repeating pattern over a longer interval and provide context for comparing waveform features.
Waveform at 10 ms/div and 1 V/div
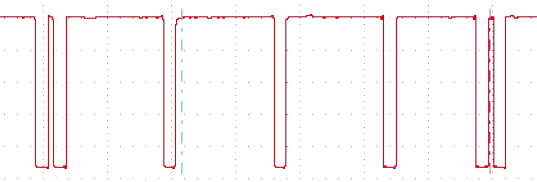
Changing the time base to 10 ms/div presents the signal over a shorter interval while the vertical setting remains at 1 V/div. Comparing captures made with these settings can make individual transitions and repeated reference features easier to examine.
Reviewing the Captured Waveform
The OWON VDS Series PC oscilloscope displays the measured waveform through its computer interface. During review, the technician can focus on signal repetition, frequency changes at different speeds, and the location of marking teeth used to evaluate the phase relationship between the camshaft and crankshaft signals.
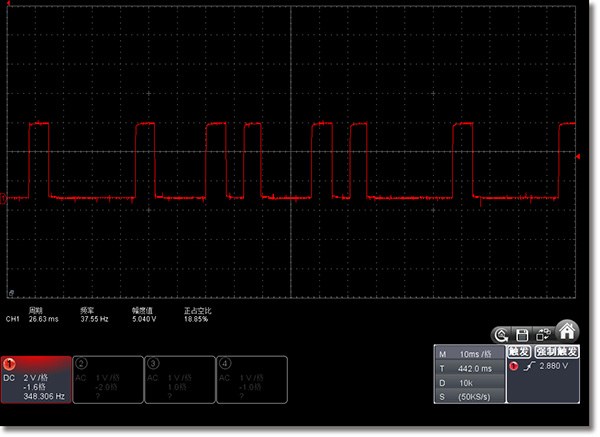
A useful review process begins with confirming that a repeatable waveform is present. The signal can then be compared across engine speeds to observe frequency behavior. When crankshaft and camshaft patterns are available, their reference features can be assessed together to determine whether the expected fixed tooth difference is maintained.
OWON VDS Series Features for Automotive Work
PC-based oscilloscope is useful in automotive maintenance because their compact bodies are easier to carry and position than conventional desktop instruments. The OWON VDS Series combines this portable format with measurement and display functions intended for practical waveform analysis.
- Bandwidth options up to 100 MHz.
- Maximum real-time sample rate of 1 GS/s 10M record length.
- FFT, X-Y, and waveform views, with two views displayed on the same screen.
- Edge, video, slope, pulse, and alternate trigger options.
- USB isolation intended to reduce signal interference and provide additional PC protection.
- USB bus power.
- Optional LAN remote control.
- Ultra-thin body design for portability.
Summary of the Inspection Procedure
Connect the BNC connector to the OWON VDS2064 and attach the dedicated probe to the measurement end.
Place the signal probe on the camshaft Hall sensor.
Attach the black clip to a metal part of the vehicle to establish a ground connection.
Observe the sensor waveform at different engine speeds and pay attention to the frequency.
Adjust the time scale to view the signal at the appropriate level of detail.
Compare the signal characteristics and the difference in tooth counts between the camshaft and crankshaft signals.
Using the OWON VDS2064 for this task gives automotive maintenance engineers a portable PC-based method for capturing and reviewing sensor behavior. The resulting waveform should be interpreted in terms of frequency, repeated marking features, and the expected fixed tooth relationship between the camshaft and crankshaft signals.