
Công dụng và Nguyên lý của Máy hiện sóng
27/12/y 08:46:20
An oscilloscope plots a graph of an electrical signal. In most applications, the graph shows how the signal changes over time: The vertical (Y) axis represents voltage and the horizontal (X) axis represents time. The intensity or brightness of the display is sometimes called the Z-axis. This simple graph can tell us a lot about a signal.
ຂ່າວທີ່ກ່ຽວຂ້ອງ

05/11/y 14:43:06
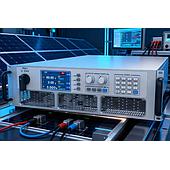
Bidirectional DC power supplies can source and absorb energy, helping PV and energy-storage teams simulate changing operating conditions in a controllable laboratory setup.
05/11/y 14:41:08
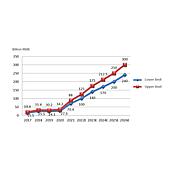
ANEVH is a bidirectional programmable DC power supply designed to support BOBC testing by combining source and load functions, simulating batteries and grid conditions, and supporting parallel operation for higher-power test needs.
05/11/y 14:40:23
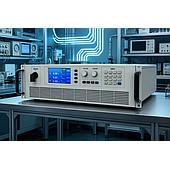
A bidirectional power supply can emulate key battery behavior while both delivering power to and absorbing returned energy, helping engineers create repeatable laboratory tests.

05/11/y 14:38:07
A 3x current-sizing approach can provide margin for appliance startup inrush, capacitor-charging peaks, and compressor starting transients that a nameplate-current source may not sustain.
ຕິດຕາມຂ່າວສານ ແລະ ຂໍ້ສະເໜີ
ຮັບສ່ວນຫຼຸດພິເສດຕາມປະລິມານ, ອັບເດດລາຄາຂາຍສົ່ງ ແລະ ການແຈ້ງເຕືອນສິນຄ້າໃໝ່ສົ່ງກົງເຖິງອິນບັອກຂອງທ່ານ.
ໂດຍການສະໝັກສະມາຊິກ, ທ່ານຍອມຮັບ ເງື່ອນໄຂການໃຫ້ບໍລິການ ແລະ ນະໂຍບາຍຄວາມເປັນສ່ວນຕົວ ຂອງພວກເຮົາ.
ການຊ່ວຍເຫຼືໍາດ່ວນ
ເຂົ້າເຖິງຜູ້ຊ່ຽວຊານທີ່ໄດ້ຮັບການຢັ້ງຢືນຂອງພວກເຮົາໂດຍກົງ