
Công dụng và Nguyên lý của Máy hiện sóng
27/12/y 08:46:20
An oscilloscope plots a graph of an electrical signal. In most applications, the graph shows how the signal changes over time: The vertical (Y) axis represents voltage and the horizontal (X) axis represents time. The intensity or brightness of the display is sometimes called the Z-axis. This simple graph can tell us a lot about a signal.
ຂ່າວທີ່ກ່ຽວຂ້ອງ
13/07/y 15:09:18
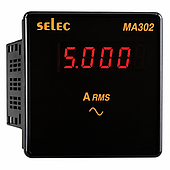
Voltmeters are almost invariably found on the panels of electrical cabinets in factories, power stations, or generator systems. A glance lasting just a few seconds allows an operator to determine whether the power supply is stable or showing signs of abnormality. However, not everyone understands the significance of the displayed readings, particularly regarding three-phase electrical systems.
13/07/y 09:48:30
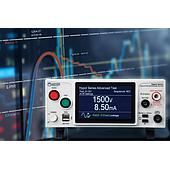
Few people realize that the concept of the "Hipot Test"—or electrical safety testing—has long existed within the electrical equipment manufacturing industry. Driven by the growing need to verify the voltage withstand capabilities of conductors, motors, and electrical devices, the industry required a robust and virtually fail-safe method to detect insulation weaknesses before products reached the market.
![[EMINxKeysight] International Electronics & Smart Manufacturing Exhibition 2026](/s-cdn/6b/6b7bfde66a6bed35f68df9f0109b0179163d72d8.png)
10/07/y 15:42:44
EMIN and Keysight sincerely thank you for taking the time to attend the 2026 International Electronics & Smart Manufacturing Exhibition in Dong Anh
10/07/y 15:10:46
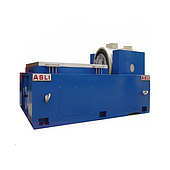
A device may operate stably for months, yet suffer cracks, broken solder joints, or snapped component leads after being transported. What surprises many engineers is that the vibration amplitude during transport is no greater than usual. The root cause lies in a specific frequency range where the product's structure absorbs energy most intensely, triggering resonance and causing continuous stress concentration at a single point.
10/07/y 10:38:40
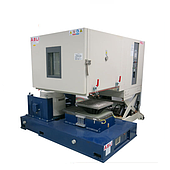
Một kiện hàng gần như không bao giờ bị rơi ngay khi vừa rời khỏi nhà máy. Quãng đường hàng trăm kilomet trên xe tải, container hay băng chuyền mới là giai đoạn diễn ra đầu tiên, nơi bao bì liên tục chịu rung lắc trong nhiều giờ. Chỉ sau đó mới đến những cú va chạm khi bốc xếp, giao nhận hoặc rơi ngoài ý muốn.
ຕິດຕາມຂ່າວສານ ແລະ ຂໍ້ສະເໜີ
ຮັບສ່ວນຫຼຸດພິເສດຕາມປະລິມານ, ອັບເດດລາຄາຂາຍສົ່ງ ແລະ ການແຈ້ງເຕືອນສິນຄ້າໃໝ່ສົ່ງກົງເຖິງອິນບັອກຂອງທ່ານ.
ໂດຍການສະໝັກສະມາຊິກ, ທ່ານຍອມຮັບ ເງື່ອນໄຂການໃຫ້ບໍລິການ ແລະ ນະໂຍບາຍຄວາມເປັນສ່ວນຕົວ ຂອງພວກເຮົາ.
ການຊ່ວຍເຫຼືໍາດ່ວນ
ເຂົ້າເຖິງຜູ້ຊ່ຽວຊານທີ່ໄດ້ຮັບການຢັ້ງຢືນຂອງພວກເຮົາໂດຍກົງ