Why Measured Amplitude Can Be Lower Than the Real Value
When a signal appears smaller on an oscilloscope than expected, the most common reason is not a faulty waveform. In many cases, the issue is the bandwidth of the oscilloscope. Bandwidth directly affects how accurately the instrument can display signal amplitude, especially as signal frequency increases.
For example, if you use a 100 MHz oscilloscope to measure a 100 MHz sine wave, the displayed amplitude may not match the true value. This is because an oscilloscope does not measure every signal frequency with the same accuracy. As the frequency approaches the scope’s bandwidth, amplitude error becomes more noticeable.
What Bandwidth Means
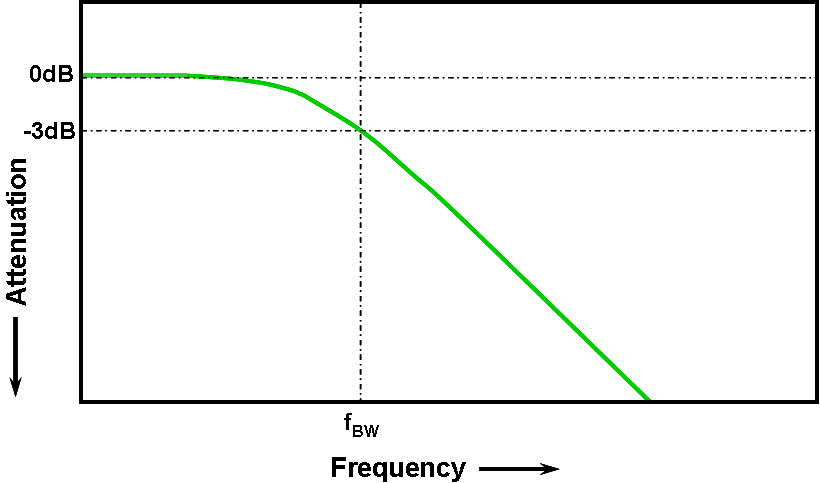
Bandwidth is an essential oscilloscope specification. It refers to the analogue bandwidth of the oscilloscope’s front end and determines how well the instrument can handle signal measurement.
In practical terms, bandwidth is the highest frequency at which a sine wave can be measured without its amplitude dropping below the 3 dB level, which is about 70.7% of the true signal amplitude. This point is also called the -3 dB cutoff frequency.
As signal frequency increases, the oscilloscope becomes less able to show the correct signal level. When the measured sine wave frequency is equal to the oscilloscope bandwidth, the measurement error may be about 30%.
Why Accuracy Drops Near the Bandwidth Limit
At the edge of bandwidth, the oscilloscope amplifier response affects the displayed signal. The source material notes that for a Gaussian response, a 100 MHz oscilloscope measuring a 100 MHz, 1 Vpp sine wave may show about 0.707 Vpp instead of the true amplitude.
This behavior is especially important when the measurement goal is precision. If very low error is required, the signal frequency should be much lower than the oscilloscope bandwidth.
A common rule mentioned in the source is the 5-times standard:
The required bandwidth of the oscilloscope = the highest frequency of the measured signal × 5
This rule helps improve measurement accuracy when working with sine waves and more complex signals.
Why Complex Waveforms Need Extra Care
Many real-world signals are more complex than a pure sine wave. They contain harmonic components that extend across a wider frequency range. If the oscilloscope bandwidth is not high enough, those harmonics may be blocked or attenuated.
When that happens, the result can include amplitude distortion, loss of edge detail, and missing waveform information. In some cases, the signal no longer provides a reliable reference for features such as bells or tones.
That is why bandwidth selection matters not only for amplitude readings, but also for overall waveform visibility and interpretation.
Selecting Bandwidth Correctly
Different measurements call for different bandwidth settings. The source gives two clear examples:
- When measuring a high-frequency signal, such as a 27 MHz crystal, full bandwidth should be used.
- If bandwidth limit is enabled and set to 20 MHz, the crystal waveform may become distorted and the measurement may lose value.
For low-frequency signals, bandwidth limit can be useful because it helps filter high-frequency interference and makes the signal easier to see. The key is to match the bandwidth setting to the type of measurement being made.
Bandwidth and Rise Time
Bandwidth is also closely related to rise time. Rise time is the time it takes for a signal to move from 10% to 90% of its maximum steady value.
The source provides a useful formula for oscilloscopes below 1 GHz:
RT = 0.35 / BW
Here, RT is rise time and BW is bandwidth. This formula helps estimate the minimum rise time the oscilloscope system can observe.
For example, if the oscilloscope bandwidth is 200 MHz, the minimum observable rise time is 1.75 ns.
Practical Takeaways
If the measured amplitude looks lower than expected, check whether the signal frequency is too close to the oscilloscope bandwidth. Also review whether bandwidth limit is enabled, because it can intentionally reduce high-frequency content.
For better results, use a bandwidth level that matches the signal type, keep the measured frequency comfortably below the scope bandwidth when accuracy matters, and remember that rise time is another important limitation.
Understanding these basics helps explain why the displayed amplitude can differ from the real value, and it makes oscilloscope measurements more reliable.
About OWON
OWON was established in 2001 in China and develops test and measurement equipment among other product lines. The brand has expanded into global markets and focuses on technological innovation, quality, service, and harmony with the world.