
Công dụng và Nguyên lý của Máy hiện sóng
2013年12月27日 08時46分20秒
An oscilloscope plots a graph of an electrical signal. In most applications, the graph shows how the signal changes over time: The vertical (Y) axis represents voltage and the horizontal (X) axis represents time. The intensity or brightness of the display is sometimes called the Z-axis. This simple graph can tell us a lot about a signal.
相关新闻
2026年07月14日 09時05分30秒
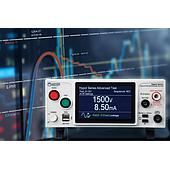
When it comes to electrical safety testing equipment specifically Hipot testers—many QA/QC and testing engineers are familiar with the globally renowned brand Associated Research. A subsidiary of the parent company IKONIX, Associated Research (ARI) invented the world's first commercial Hipot tester.
2026年07月13日 15時09分18秒
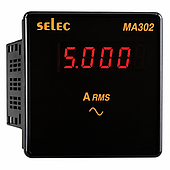
Voltmeters are almost invariably found on the panels of electrical cabinets in factories, power stations, or generator systems. A glance lasting just a few seconds allows an operator to determine whether the power supply is stable or showing signs of abnormality. However, not everyone understands the significance of the displayed readings, particularly regarding three-phase electrical systems.
2026年07月13日 09時48分30秒
Few people realize that the concept of the "Hipot Test"—or electrical safety testing—has long existed within the electrical equipment manufacturing industry. Driven by the growing need to verify the voltage withstand capabilities of conductors, motors, and electrical devices, the industry required a robust and virtually fail-safe method to detect insulation weaknesses before products reached the market.
![[EMINxKeysight] International Electronics & Smart Manufacturing Exhibition 2026](/s-cdn/6b/6b7bfde66a6bed35f68df9f0109b0179163d72d8.png)
2026年07月10日 15時42分44秒
EMIN and Keysight sincerely thank you for taking the time to attend the 2026 International Electronics & Smart Manufacturing Exhibition in Dong Anh
2026年07月10日 15時10分46秒
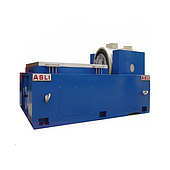
A device may operate stably for months, yet suffer cracks, broken solder joints, or snapped component leads after being transported. What surprises many engineers is that the vibration amplitude during transport is no greater than usual. The root cause lies in a specific frequency range where the product's structure absorbs energy most intensely, triggering resonance and causing continuous stress concentration at a single point.
快速支持
直接联系认证专家