
Uses and principles of the oscilloscope
12/27/2013 08:46:20
An oscilloscope plots a graph of an electrical signal. In most applications, the graph shows how the signal changes over time: The vertical (Y) axis represents voltage and the horizontal (X) axis represents time. The intensity or brightness of the display is sometimes called the Z-axis. This simple graph can tell us a lot about a signal.
Related News

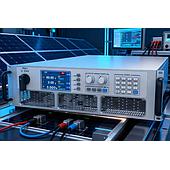
11/05/2026 14:43:06
Bidirectional DC power supplies can source and absorb energy, helping PV and energy-storage teams simulate changing operating conditions in a controllable laboratory setup.
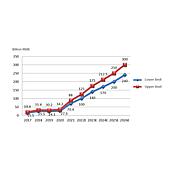
11/05/2026 14:41:08
ANEVH is a bidirectional programmable DC power supply designed to support BOBC testing by combining source and load functions, simulating batteries and grid conditions, and supporting parallel operation for higher-power test needs.
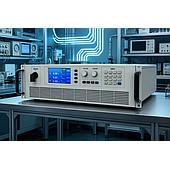
11/05/2026 14:40:23
A bidirectional power supply can emulate key battery behavior while both delivering power to and absorbing returned energy, helping engineers create repeatable laboratory tests.
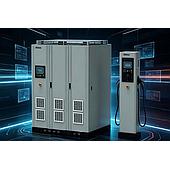
11/05/2026 14:37:13
Bidirectional DC test power supplies combine source and regenerative-load operation to test EV chargers under controlled charging, discharge, and dynamic-load conditions.
Stay Updated with Offers
Get exclusive volume discounts, bulk pricing updates, and new product alerts delivered directly to your inbox.
By subscribing, you agree to our Terms of Service and Privacy Policy.
Quick Support
Direct access to our certified experts