Basic fault-finding
The PicoScope 4262 is a high-precision oscilloscope that is also suitable for general-purpose fault-finding. With two input channels, it can display signals in both time domain and frequency domain views, or even both at the same time. Spectrum views provide a number of automatic measurements including distortion and noise.
Dynamic range
The analog to digital converters in most digital oscilloscopes have 8-bit resolution, which produces 256 quantization levels. This is equivalent to an ideal dynamic range of 48 dB. The PicoScope 4262 has a 16-bit analog to digital converter which produces 65,536 quantization levels, increasing the dynamic range to 96 dB.
96 dB is the best theoretical figure, but in practice the acquisition system will have some noise that will reduce the actual usable dynamic range.
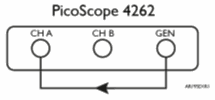
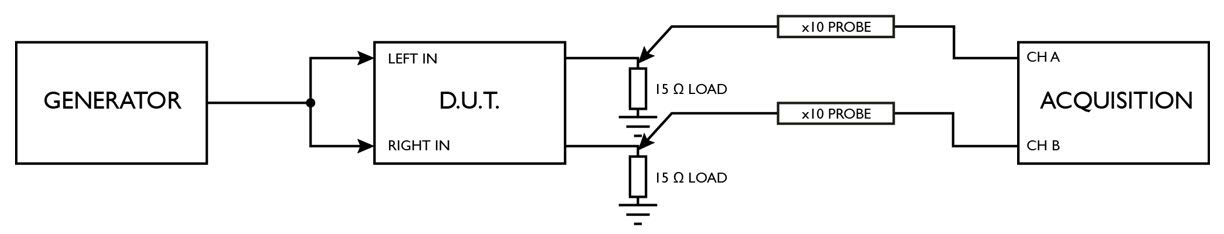
The dynamic range of the generator and acquisition system was measured with the generator output directly connected to the channel A input, as in Figure 1.
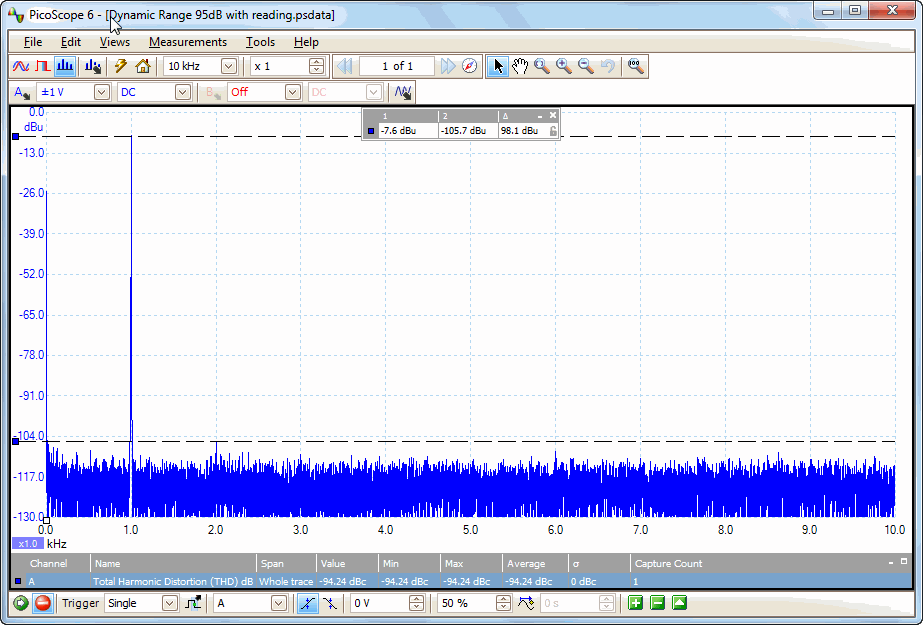
To measure the dynamic range we aligned the two channel A rulers (controlled by the blue squares next to the y-axis) with the signal peak and the noise floor. The ruler legend then showed the dynamic range, given by the delta between the two rulers, to be –98 dB.
Monitoring waveform distortion
This test measures distortion in a stereo amplifier. It shows how PicoScope’s automatic distortion measurement can detect harmonics even when the time-domain waveform looks clean. The PicoScope 4262 has more than enough dynamic range to capture these signals without adding significant noise or distortion of its own.
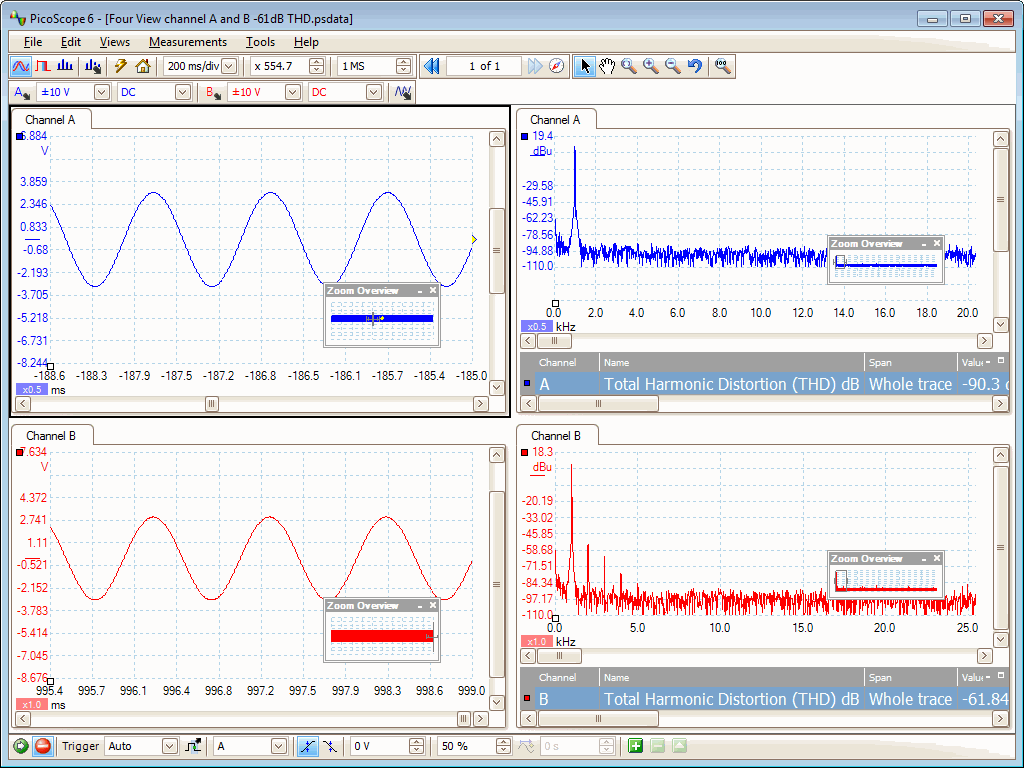
Figures 4 and 5 show the PicoScope screen divided into four views: a time-domain and a spectrum view for each of the two channels. Each view is easily created by right-clicking on the default view and selecting Add View.
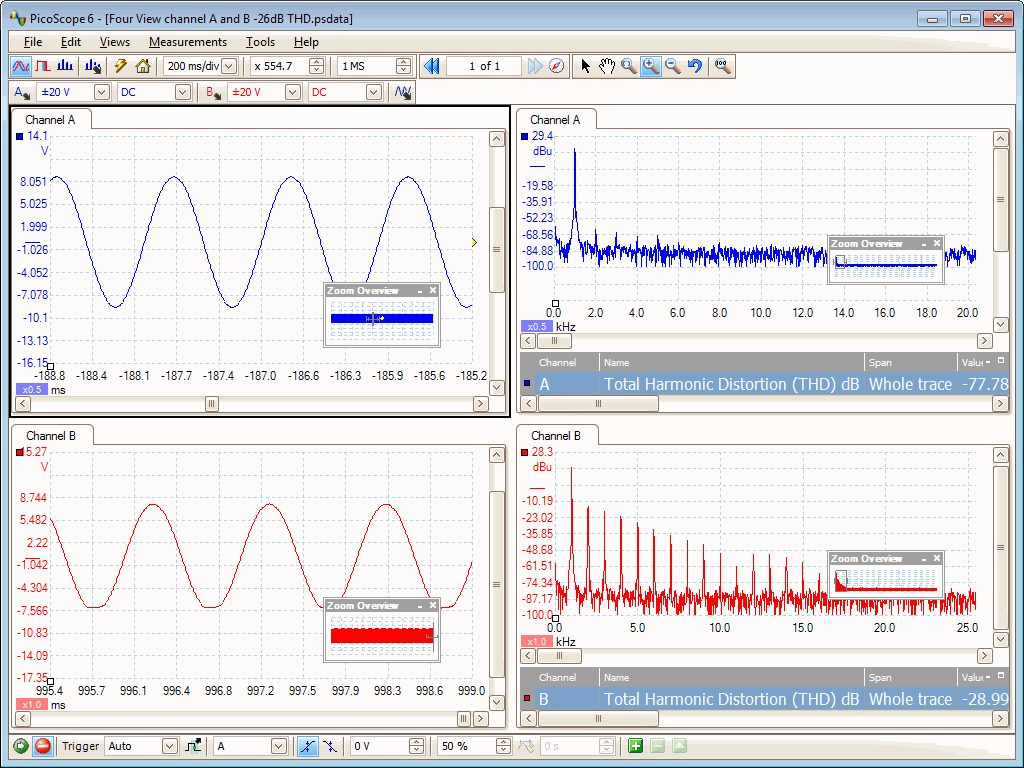
The channel B spectrum has THD of –28 dB at this level. We can start to see the distortion in the time-domain display (lower left panel).
Glitch detection
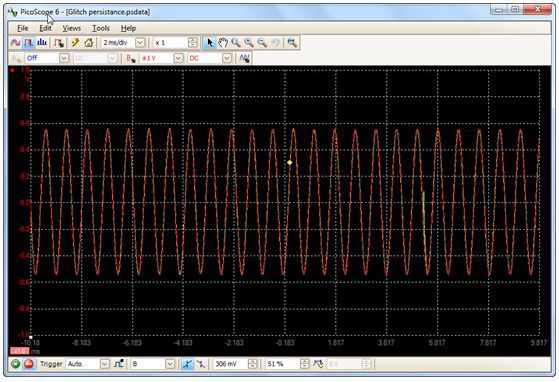
PicoScope’s Persistence Display mode is useful for capturing unwanted clicks or glitches in an audio signal. In a normal oscilloscope display these signals appear on the screen for only a fraction of a second, so there is little chance of performing accurate measurements on them. Persistence mode causes old waveforms to remain in the background while newer waveforms are drawn on top.
The main choice to be made in Persistence Options is between Color Persistence and Analog Intensity modes.
Color Persistence mode, as shown in Figure 7, can display new updates in brighter colors than old waveforms, making glitches stand out.
Analog Intensity mode has a similar effect but using shades of a single color. This is more like the display of an analog persistence scope.
Conclusion
The high resolution of the PicoScope 4262 makes it ideal for low-noise, low-distortion measurements, and its built-in signal generator removes the need for an additional signal source. With its 5 MHz bandwidth, it can easily analyze audio, ultrasonic and vibration signals, characterize noise in switched mode power supplies, measure distortion and perform a wide range of precision measurement tasks.
![[EMINxKeysight] International Electronics & Smart Manufacturing Exhibition 2026](/s-cdn/6b/6b7bfde66a6bed35f68df9f0109b0179163d72d8.png)