In a facility equipped with numerous motors, variable frequency drives (VFDs), compressors, CNC machines, or automated production lines, the kilowatt-hour (kWh) reading on an electricity meter is often insufficient to explain rising electricity costs or to determine the operational stability of specific equipment. Even with the same level of energy consumption, power quality and the nature of the electrical load can vary significantly.
Consequently, the need to monitor three-phase power typically encompasses two distinct aspects: tracking the amount of electricity consumed and assessing the performance and quality of the power supply itself.
What parameters need to be recorded for continuous 3-phase power monitoring?
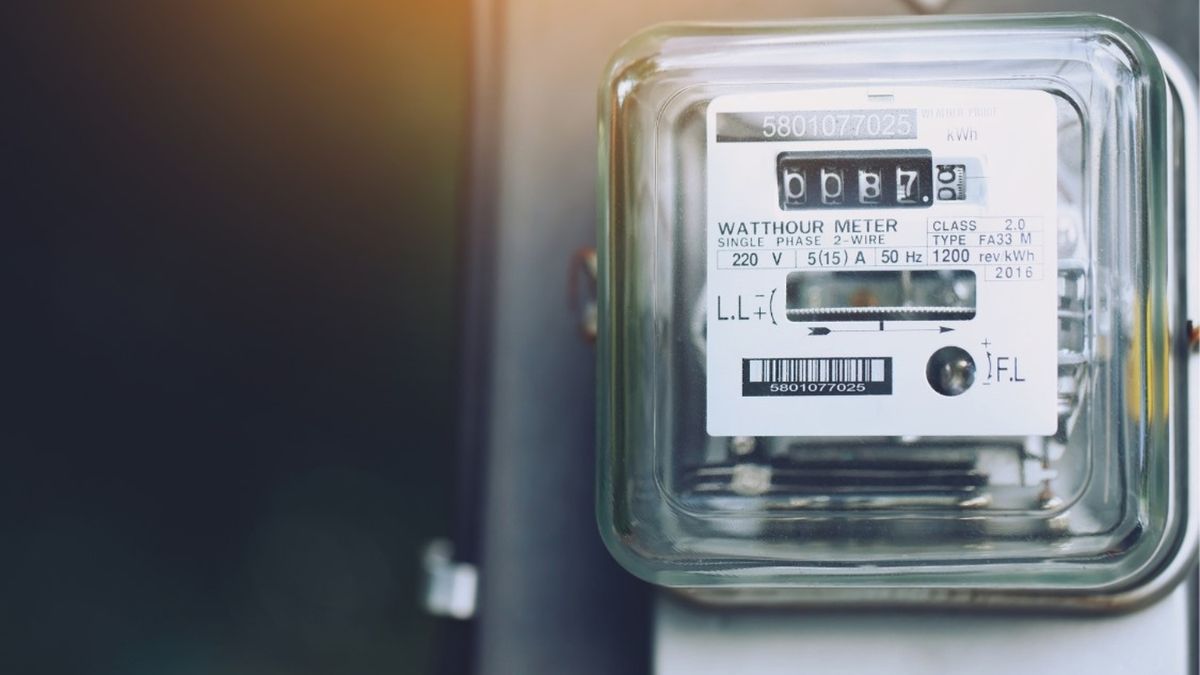
A standard 3-phase power monitoring device typically tracks voltage, current, power, and energy consumption for each phase. Time-stamped data allows technical personnel to identify periods of sharp load increases or unusual fluctuations.
For instance, a production line might normally consume around 40 kW during the morning shift but spike to 65 kW at a specific time. Continuous monitoring data helps pinpoint exactly when this load level occurs, rather than relying on end-of-month electricity bills.
Key parameters typically monitored include:
+ Phase voltage.
+ Phase current.
+ Active power (kW).
+ Energy consumption (kWh).
+ Reactive power (kVAR).
+ Power factor.
+ Phase imbalance.
Depending on the application, data can be viewed directly on a display screen or mobile app, or transmitted to a computer, PLC, or SCADA system.
To determine when the factory consumes the most electricity, time-series data is required
A single measurement at the electrical panel only reflects the power status at that specific moment, whereas continuous data logging reveals the entire pattern of load fluctuations.
This feature is particularly valuable for factories operating multiple shifts. Supervisors can compare electricity consumption across hours, days, or shifts to identify periods of unusually high usage.
Historical data also facilitates comparisons between production days, different production lines, or periods before and after equipment upgrades.
For instance, if a production line's power consumption rises significantly after a motor replacement, having baseline data allows engineers to quickly detect the change and proceed to inspect the load, the motor, or operating conditions.
Three-phase electricity meter meeting basic energy monitoring needs
For needs primarily centered on electricity consumption, the 3-phase electronic meter is a widely adopted solution. These devices can be permanently installed in electrical cabinets to record parameters such as voltage (V), current (A), power (kW), and energy consumption (kWh).
Some models feature wireless connectivity, allowing data to be viewed on a smartphone, while others utilize RS-485/Modbus interfaces to transmit data to controllers or energy management software.
This approach is well-suited for monitoring consumption across a specific area, a production line, or an entire factory.
However, the situation changes when a business needs to identify the root cause of abnormal machinery operation, circuit breaker trips, or intermittent production line stoppages.
Looking solely at the kWh figure is not enough to determine whether there is an issue with the power source
A production line may consume electricity at normal levels yet still experience voltage sags, overvoltage, phase imbalance, or harmonics. Since these phenomena can occur over very brief intervals, standard electricity meters often fail to reveal the underlying cause.
In particular, power electronics, variable frequency drives (VFDs), switched-mode power supplies, CNC machines, and automated production lines can be sensitive to fluctuations in the power supply.
Consequently, the focus shifts from simply asking "how much electricity is the factory consuming?" to identifying "what issues are affecting the power supply?"
This is where power quality analyzers demonstrate their true value.
Power quality analyzers provide deeper insight into 3-phase power systems.
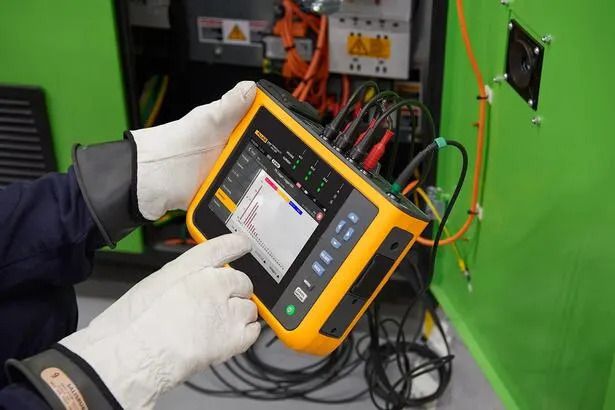
Devices such as Fluke power quality analyzers can record various power parameters over extended periods while capturing anomalies for subsequent analysis by engineers.
The key difference lies in the volume of data collected. Beyond power and energy measurements, these devices facilitate the analysis of issues such as:
+ Voltage sags and swells occurring during operation.
+ Voltage and current harmonics causing waveform distortion.
+ Phase imbalances.
+ Power factor and reactive power.
+ Anomalous events at the source or load.
Consequently, the measured data can be used to identify root causes rather than simply recording consumption levels.
For instance, given the same level of active power, a low power factor necessitates higher current. Monitoring power, current, and power factor provides engineers with the necessary data to evaluate the condition of the load and the reactive power compensation system.
Elevated harmonics can be detected from continuous measurement data
Electronic loads such as variable frequency drives (VFDs), power supplies, UPS units, and power control devices can introduce harmonic components into the power supply.
High harmonic levels can cause overheating in conductors, transformers, and other electrical components, while also affecting sensitive equipment.
A standard electricity meter that merely records energy consumption cannot answer this question. A power quality analyzer, however, can capture harmonic components and display voltage and current distortion levels in real time. This is why continuous monitoring data is far more valuable than a single measurement when troubleshooting issues.
Understanding harmonics:
What are harmonics? Effective methods for mitigating harmonic interference.
Reducing the adverse effects of harmonics on the power grid
Where should continuous monitoring begin?
Implementation can begin at the main electrical panel and subsequently expand to branches with high consumption or frequent operational issues.
The first step is to record voltage, current, power, and energy consumption for each phase to establish a baseline dataset.
Next, monitor the load across production shifts to identify periods of peak power demand or unusual fluctuations.
Subsequently, if the facility experiences brief power outages, automatic equipment restarts, variable frequency drive (VFD) error alerts, or abnormal motor overheating, a power quality analyzer can be deployed to capture the specific events and associated waveforms.
Finally, cross-reference the power data with production schedules, machinery status, and maintenance records. This approach enables the root cause to be pinpointed based on data rather than guesswork.
Read more: Identifying the causes of short-term power outages using a power analyzer
Selecting the right and standard equipment
Monitoring 3-phase power does not always require a high-end power quality analyzer.
Facilities needing to track energy consumption by specific area can start with 3-phase meters or power meters capable of data logging. If the system requires data transmission to a PLC or SCADA, devices supporting RS-485/Modbus are the preferred choice.
However, for locations frequently experiencing voltage dips, overvoltage, harmonics, phase imbalance, or elusive electrical issues, the FLUKE-1773 and similar power quality analyzers are better suited for recording and analysis.
The key lies in determining whether the business needs to monitor energy usage or investigate how power quality affects machinery; these two requirements may call for completely different categories of equipment.
EMIN provides power measurement and quality analysis solutions for factories, electrical panels, production lines, and 3-phase loads, helping businesses establish power monitoring systems tailored to their scale and specific operational needs.