Quantitative analysis of goose and duck down blends is an important inspection task for thermal textile materials. Because the two materials may be combined in different proportions, a dependable workflow needs to identify meaningful spectral differences while accounting for sample variation, imaging conditions, and data quality. Hyperspectral camera offers a way to collect spatial and spectral information from a sample in one acquisition process.
For electronics manufacturing and inspection teams developing material-analysis workflows, the value of this approach lies in its structured sequence: prepare known samples, acquire consistent images, preprocess the data, extract spectral features, build a quantitative model, and verify the result with independent samples. Each stage affects whether the final analysis is stable and repeatable.
Why Analyze Goose and Duck Down Blends?
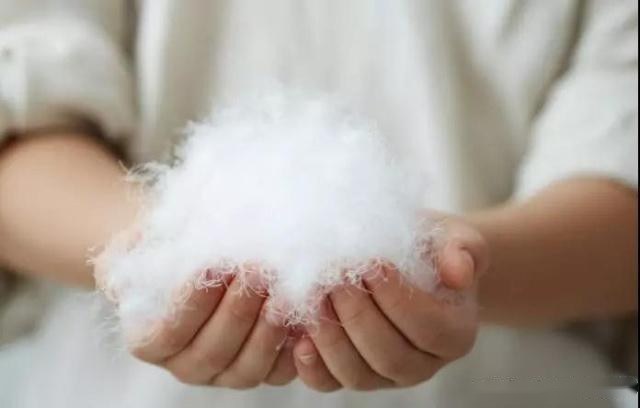
Goose down and duck down are used as raw materials for thermal products. When blend composition must be assessed, visual inspection alone may not provide the quantitative information required for a controlled evaluation process. A hyperspectral camera can capture reflectance information across many wavelengths, creating data that can be evaluated for differences between the materials.
The source workflow focuses on visible-to-near-infrared imaging. By associating spectral responses with samples of known composition, an analysis model can be trained to estimate the composition of additional mixed samples. The result depends not only on the camera, but also on representative reference samples, careful sample handling, and appropriate validation.
1. Prepare Reference Samples With Known Blend Ratios
The process begins with pure goose down and pure duck down samples selected as reference materials. These materials are weighed and combined at known proportions to create a series of mixed samples. Multiple blend ratios and repeated samples help provide a broader data set for later training and verification.
Sample presentation is also important. Each blend should be spread evenly on the sample table so that the camera observes a consistent surface. Areas with overlaps, gaps, or uneven distribution can introduce local variation into the captured image. Preparing several repeats at each known ratio can help assess whether the workflow responds consistently rather than relying on a single sample image.
2. Acquire Hyperspectral Images Consistently
The source describes the FS-13 hyperspectral camera for related research. Its stated spectral range is 400–1000 nm, with wavelength resolution better than 2.5 nm and up to 1200 spectral channels. The source also states a full-spectrum acquisition speed of up to 128 FPS and a maximum of 3300 Hz after band selection, with multi-region band selection support.
For blend analysis, each sample can be imaged multiple times and from different angles. This practice is intended to reduce the influence of localized sample features. Image data should be transferred and stored after acquisition so that the data set remains complete for processing, modeling, and later review.
3. Preprocess Data Before Spectral Comparison
Raw hyperspectral data may contain effects caused by equipment behavior, environmental conditions, camera angle, or sample placement. Preprocessing is used to make images more comparable before features are interpreted. The workflow described in the source includes radiometric correction, geometric correction, and image denoising.
Radiometric correction addresses radiometric differences between images. Geometric correction is used to address distortion related to imaging angle or sample position, helping retain accurate pixel locations. Denoising through filtering methods can reduce unwanted image interference and improve the clarity of the information used for feature extraction.
4. Extract Spectral Features of Each Material
After preprocessing, software tools and algorithms can be used to isolate and compare spectral characteristics associated with goose down and duck down regions. The goal is to identify wavelength areas where their reflectance responses differ in a useful way.
The source notes observable differences in reflectance curves between 700 nm and 800 nm. This range can serve as one basis for distinguishing the two materials within a larger spectral feature set. Reflectance values at relevant wavelengths are recorded to form data sets representing the spectral characteristics of the reference materials.
5. Build and Validate a Quantitative Model
Known-ratio samples provide the foundation for a quantitative model. A portion of the data set is used for training, allowing the model to learn the relationship between spectral features and blend proportion. The remaining samples are reserved for validation rather than included in training.
The source identifies support vector machine and partial least squares methods as possible modeling approaches. During validation, spectral image data from the reserved samples is entered into the model, and the predicted blend ratio is compared with the known ratio. Measures such as root-mean-square error and mean absolute error can be used to evaluate differences between predictions and reference values.
Validation results can also guide refinement. Depending on the findings, the modeling process may be adjusted through parameter changes or by revising the selected feature variables. This iterative approach helps ensure that the model is assessed on data it did not use for training.
6. Review Stability and Repeatability
A complete evaluation summarizes results across the blend ratios and repeated samples. Statistical review may include the mean and standard deviation of results at different ratios, providing a basis for examining stability and repeatability. The source also describes comparing hyperspectral results with traditional methods such as chemical analysis as part of method evaluation.
Multispectral camera detection of goose and duck down blends is therefore best viewed as a complete measurement workflow rather than a camera-only task. Consistent reference samples, repeatable image acquisition, data correction, carefully selected spectral features, and independent validation all contribute to a meaningful quantitative assessment.