To measure regulator output impedance on an LM117, connect the J2111A current injector output and a scope probe to the regulator output, then use the analyzer connections and sweep settings described below. For a small-signal load-step test, replace the analyzer modulation with an AWG and remove the injector bias current.
These two setups use the same injector and regulator output connection, but they observe different behavior: frequency-dependent output impedance versus the voltage response to a pulsed load.
Summary: Use the injector bias switch in the “+” position for a positive-regulator impedance measurement. A 100 Hz to 10 MHz sweep, 0 dBm starting level, and receiver bandwidth or IF frequency of no more than 100 Hz are suggested settings. For a small-signal load step, set the bias switch to its middle position and use an AWG square pulse.
How is the J2111A connected for an LM117 output impedance measurement?
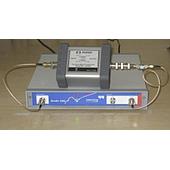
Connect the J2111A current injector output and a scope probe to the LM117 output. A 1X scope probe is preferred in this setup for the best sensitivity.
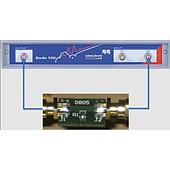
Connect the scope probe to the analyzer “T” input with a 1 MΩ termination. Connect the current monitor from the current injector to the “R” input with a 50 Ω termination, and connect the analyzer LF Output to the injector modulator input.
For a positive regulator measurement, move the current injector bias switch to the “+” position. This bias-switch position is specific to the positive-regulator measurement described here.
Which sweep settings are suitable for measuring regulator output impedance?
A sweep from 100 Hz to 10 MHz is a practical starting range for this measurement. Starting at 100 Hz rather than 10 Hz can make the sweep less time-consuming.
| Measurement setting | Suggested starting value or condition |
|---|---|
| Frequency sweep | 100 Hz to 10 MHz |
| Signal level | 0 dBm |
| Receiver bandwidth or IF frequency | At most 100 Hz |
| Points per decade | 401 |
Using more than 401 points per decade is possible, although it may not be necessary. If an impedance peak near the LM117 bandwidth looks aliased or truncated, increase the points per decade and/or narrow the sweep span around that peak.
Which traces should be displayed for an output impedance test?
Display impedance magnitude, |Z|, and group delay, Tg, on separate grids. With two traces on one grid, only the axis associated with the selected trace is displayed at a time.
Use a logarithmic y-scale for impedance magnitude. A logarithmic group-delay scale is theoretically useful only when the absolute value of group delay can first be obtained; the supplied information notes that this requires a Visual Basic code-based macro.
A screenshot and CSV capture can still preserve the results for later use. The CSV data can be moved into a spreadsheet or a simulator waveform viewer for examination.
How do you create a small-signal load step with the same injector?
For a small-signal load-step test, change the injector modulator source from the network analyzer to an AWG. Set the injector bias switch to the middle position, which applies no bias current.
Connect both the scope probe and current monitor to an oscilloscope. Generate a square voltage pulse with the AWG; the injector then presents a square load pulse at the regulator output.
| AWG pulse voltage | Represented load-step current |
|---|---|
| 0 to 1 V | 0 to 10 mA |
The stated voltage-to-load-current scaling is 100:1. Therefore, the 0 to 1 V AWG pulse corresponds to a 0 to 10 mA load step in this setup.
What termination and triggering details matter during a load-step test?
Terminate the current monitor into 50 Ω and AC-couple the voltage waveform to see the output voltage response more clearly. These connections support observation of the regulator response to the load pulse rather than its DC level.
Triggering from the AWG “Sync” output is identified as the easiest option. Triggering from the load-current pulse can also be used.
Note: The connections and settings above are described for the LM117 example and the named J2111A-based setup. Verify instrument termination, coupling, and operating conditions before applying the method to another regulator or test configuration.