
Manual datasheet
2013年12月27日 08時46分20秒
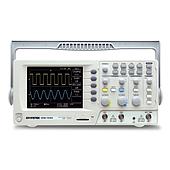
An oscilloscope plots a graph of an electrical signal. In most applications, the graph shows how the signal changes over time: The vertical (Y) axis represents voltage and the horizontal (X) axis represents time. The intensity or brightness of the display is sometimes called the Z-axis. This simple graph can tell us a lot about a signal.

快速支持
直接联系认证专家